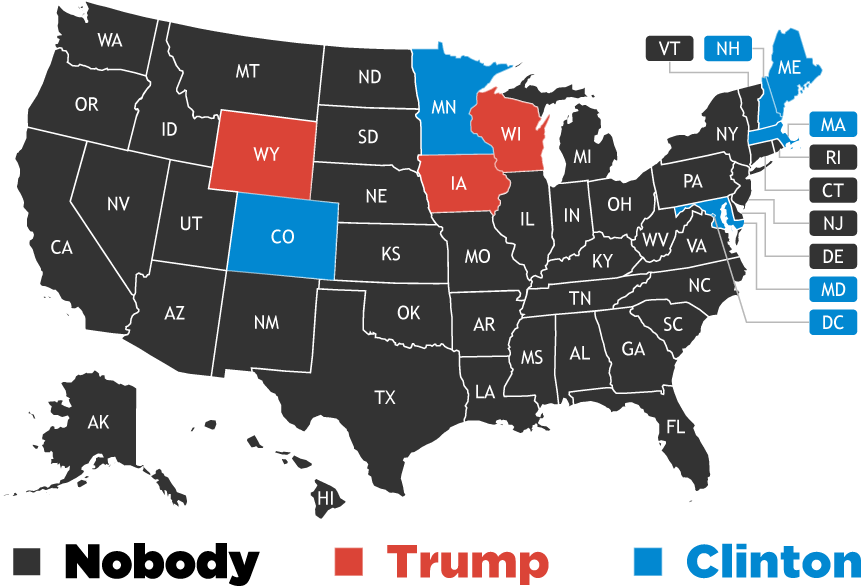
Who Won The Majority of Eligible Votes In Your State?

40.7% Of Eligible Voters Did Not Vote
As of February 20, 2017Perhaps the biggest winner of the 2016 United State's General Election for President was apathy. Out of the 230,593,103 people eligible to vote for President on election day, only 136,665,420 (59.7%) registered and did so. The following chart plots the the total vote count by state as a percentage of the Voting-Eligible Population (Highest Office Vote) for that state.
| No-Vote | Clinton | Trump | |
|---|---|---|---|
| Alabama | 41.10% | 20.26% | 36.58% |
| Alaska | 38.70% | 22.44% | 31.45% |
| Arizona | 44.60% | 24.99% | 26.98% |
| Arkansas | 47.30% | 17.76% | 31.94% |
| California | 43.30% | 34.98% | 17.92% |
| Colorado | 29.90% | 33.79% | 30.35% |
| Connecticut | 35.80% | 35.05% | 26.26% |
| Delaware | 35.60% | 34.39% | 26.98% |
| District of Columbia | 39.10% | 55.36% | 2.50% |
| Florida | 35.30% | 30.93% | 31.70% |
| Georgia | 40.70% | 27.22% | 30.24% |
| Hawaii | 57.80% | 26.25% | 12.66% |
| Idaho | 40.90% | 16.25% | 35.05% |
| Illinois | 38.10% | 34.54% | 24.02% |
| Indiana | 43.60% | 21.32% | 32.09% |
| Iowa | 31.60% | 28.52% | 34.95% |
| Kansas | 42.30% | 20.83% | 32.72% |
| Kentucky | 41.30% | 19.19% | 36.69% |
| Louisiana | 40.00% | 23.04% | 34.86% |
| Maine | 29.50% | 33.70% | 31.65% |
| Maryland | 33.40% | 40.16% | 22.58% |
| Massachusetts | 32.80% | 40.32% | 22.04% |
| Michigan | 35.30% | 30.60% | 30.73% |
| Minnesota | 25.80% | 34.43% | 33.32% |
| Mississippi | 44.40% | 22.30% | 32.19% |
| Missouri | 37.70% | 23.74% | 35.39% |
| Montana | 38.50% | 21.96% | 34.56% |
| Nebraska | 37.50% | 21.06% | 36.69% |
| Nevada | 42.70% | 27.45% | 26.07% |
| New Hampshire | 28.60% | 33.42% | 33.20% |
| New Jersey | 36.00% | 35.52% | 26.50% |
| New Mexico | 45.20% | 26.47% | 21.92% |
| New York | 43.20% | 33.51% | 20.73% |
| North Carolina | 35.20% | 29.94% | 32.27% |
| North Dakota | 39.10% | 16.56% | 38.37% |
| Ohio | 37.10% | 27.42% | 32.52% |
| Oklahoma | 47.70% | 15.11% | 34.15% |
| Oregon | 33.60% | 33.27% | 25.96% |
| Pennsylvania | 37.00% | 30.18% | 30.62% |
| Rhode Island | 40.90% | 32.15% | 22.99% |
| South Carolina | 43.20% | 23.12% | 31.18% |
| South Dakota | 41.50% | 18.54% | 35.98% |
| Tennessee | 48.80% | 17.77% | 31.08% |
| Texas | 48.40% | 22.29% | 26.94% |
| Utah | 43.30% | 15.59% | 25.80% |
| Vermont | 36.30% | 36.12% | 19.30% |
| Virginia | 33.90% | 32.92% | 29.35% |
| Washington | 35.30% | 33.51% | 23.49% |
| West Virginia | 50.00% | 13.25% | 34.30% |
| Wisconsin | 30.60% | 32.27% | 32.76% |
| Wyoming | 40.30% | 13.07% | 40.72% |
| UNITED STATES | 40.70% | 28.58% | 27.34% |
To learn more about how this data was compiled and about the definition of Voting-Eligible turnout visit: